On June 1, the Themed Entertainment Association (TEA) and AECOM released the latest edition of their annual Theme Index, profiling attendance figures and trends for the theme park industry. In this article, we’ll be analyzing attendance over calendar year 2016 for Disney’s parks worldwide. The attendance figures come directly from the report and, while the Theme Index contains analysis from the economists at AECOM, we’ve opted to analyze the figures ourselves.
On the global attendance scale, not surprisingly, Disney maintains the top spot, with 140,403,000 visitors, up 1.8% over 2015. Second on the list is Merlin Entertainments, with 61,200,000 visitors, up 1.2% over 2015. Most North Americans are unfamiliar with the company name, however Merlin’s brands – such as Madame Tussauds, SEA LIFE Aquarium, the London and Orlando Eye observation wheels, and LEGOLAND – can be found in high traffic tourism regions and retail/entertainment districts throughout the United States and Canada.

Universal ranks third at 47,356,000 visitors, up 5.5% from 2015. Ranking fourth, fifth, and seventh are Chinese chains OCT, Fantawild, and Chimelong, respectively. Two regional players in North America, Six Flags at sixth and Cedar Fair – whose parks include Knott’s Berry Farm and Cedar Point – at eighth also made the global chains list. At ninth is SeaWorld Parks & Entertainment, with 22,000,000 guests at its twelve parks, down 2.1% from the year before. Rounding out the top ten list is Parques Reunidos, the Spanish chain which late last year opened two new major parks in Dubai.
DISNEY
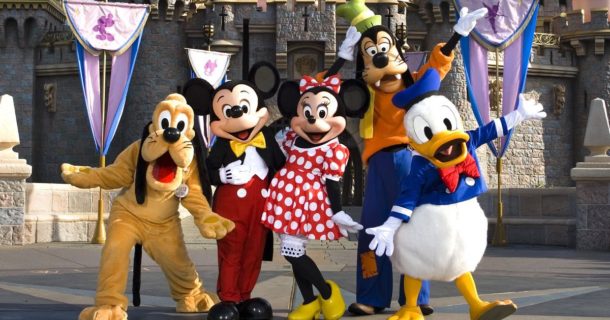
Every single Disney theme park made the top 25 list for most attended theme parks worldwide. Walt Disney World’s two waterparks are ranked in the top three attended waterparks worldwide.
In California, Disneyland Park ranked #2 both in North America (defined as the US and Canada by the report, with Mexico being included with Latin America) and globally, with 17,943,000 guests, down 1.8%. California Adventure ranked #8 for North America and #11 worldwide, with 9,295,000, down 0.5%. Attendance at both parks remained stable due to the end of the 60th Anniversary celebration, new and returning seasonal events, and the final opportunity to ride to Tower of Terror. However, extensive construction within the park, a substantial change in ticketing pricing structure, inclement weather in the first half of the year, and no new major attractions combined with competition from increased offerings at Universal Studios Hollywood to prevent attendance growth.

In Florida, The Magic Kingdom remains the most visited theme park in the world, with 20,395,000, down slightly 0.5% from 2015. Ranking third on the North American list and sixth globally (outperformed by three Japanese parks) is EPCOT, with 11,712,000, down 0.7%. Animal Kingdom ranks fourth in North America and seventh worldwide, with 10,844,000, down 0.7%. Disney’s Hollywood Studios came in fifth in North America and eighth worldwide with 10,776,000, down 0.5%. Many of the same factors affecting the California parks also affected Florida, including weather, ticket price changes, extensive construction at both Animal Kingdom and Hollywood Studios, and continued competition from the Harry Potter offerings at Universal Orlando resort.
Animal Kingdom remains the most visited animal-based theme park in the world, with almost two million more visitors than Chimelong Ocean Kingdom in Zhuhai China and more than twice as many visitors as Busch Gardens Tampa Bay or SeaWorld Orlando.
The two Walt Disney World waterparks remained strong, though both showed a negligible drop over the prior year. Typhoon Lagoon ranked first in North America and second globally with 2,277,000, down 0.7% and Blizzard Beach ranked second in North America and third in the world with 2,091,000, down 0.8%. The most attended waterpark in the world remains Chimelong Water Park in Guangzhou, China, which saw a 7.9% increase from 2015 to 2,538,000 visitors.
The most visited theme park in Europe, ranking thirteenth on the global chart, is Disneyland Paris, with 8,400,000, down 14.2%. Walt Disney Studios Paris ranked 4,970,000, a drop of 1.6%, placing it third on the European parks list and twenty-second worldwide. The Disneyland Paris resort suffered everything from terror threats to severe rains to employee strikes, but it was the closure of Big Thunder Mountain Railroad for eleven months of 2016, along with Star Tours’ closure in March to prepare for the expansion of the attraction into Star Tours: The Adventures Continue in 2017, that sent park guests to the Studios park for the final performances of Animagique, the new Mickey and the Magician show, and continued interest in the Ratatouille and Tower of Terror attractions. This resulted in a higher drop in attendance for the Disneyland park and a much lower one for the Studios park than anticipated, but was not enough attendance transferred from one park to the other to allow growth.
In Asia, Tokyo Disneyland ranked number one (third worldwide after the Magic Kingdom and Anaheim’s Disneyland), with 16,540,000 visitors, down 0.4%, while Tokyo DisneySea ranked third (behind Universal Studios Japan) and fifth worldwide, with 13,460,000, down 1%. Although Tokyo Disneyland celebrated its 15th anniversary in 2016, new attractions for the park were delayed until 2017, which, when compounded with a new Harry Potter land at Universal Studios Hollywood, resulted in a similar attendance pattern to the California Disney parks – stability, but no growth.
Hong Kong Disneyland came in at seventh in Asia and seventeenth worldwide, with 6,100,000, down 10.3%. As with the other theme park operator in Hong Kong, Ocean Park, three key factors came into play for the drastic decrease. First was the unfavorable exchange rate between the US and Hong Kong dollars. Second was the permit process for entering Hong Kong that the Chinese government instituted two years ago for Mainland Chinese. It now requires Chinese citizens to return to their hometowns to apply for travel permits, even if those hometowns are thousands of miles from where they live. The Chinese government also restricted the number of cities in which permits are granted. Third, a number of unethical tour operators from Mainland China to Hong Kong have had a negative impact on tour group operations, especially after one visit resulted in tourists being locked in a store until they agreed to purchase expensive items at markup, an event that resulted in the murder of one of the tourists. The negative tourism environment in Hong Kong has been beneficial to the industry in mainland China, with new theme parks opening and existing parks seeing a marked increase. For example, Chimelong Ocean Kingdom, which opened in 2014 in Zhuhai, a three hour drive from Hong Kong (45 minutes once a new bridge opens), saw a 13.2% increase over the same period, making it the most visited theme park in China for 2016.
Rounding out the Disney parks is the new Shanghai Disneyland, which opened in June, with 5,600,000, placing it tenth in Asia and twenty-first worldwide. Keep in mind this figure is only for half a year of operation. The park is expected to continue strong attendance as it blends elements of Chinese culture with Disney lore.
BONUS: UNIVERSAL AND SEAWORLD
Since we also cover Universal and SeaWorld, we felt it important to include their numbers as well.

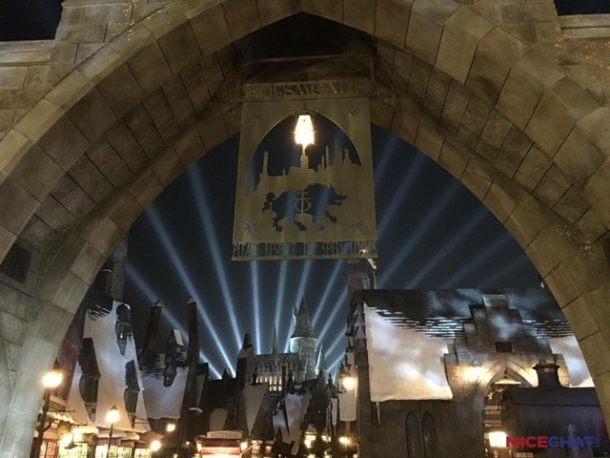
Comcast owns four theme parks and one waterpark and licenses an additional theme park in Singapore to Genting at Resort Worlds Sentosa. Until September 2015, USJ, the operating company of Universal Studios Japan in Osaka, had also been a licensee. With the purchase of a majority stake in the company (later expanded to 100% ownership) by Comcast, it fell under the same operating umbrella as the Hollywood and Orlando parks, with 2016 being the first full year of the park’s operation under Comcast control. The Universal Studios parks in Hollywood and Osaka saw attendance growth through the introduction of the Wizarding World of Harry Potter at each park, while Universal Studios Orlando saw growth through the introduction of Diagon Alley, which also fueled growth through its direct connection to Hogsmeade at Islands of Adventure. Attendance at Wet ‘n’ Wild Orlando remained stable in its final full year of operation.
Attendance figures for Universal are as follows:
Universal Studios Hollywood
8,086,000 up 13.9% #9 North America, #15 worldwide
Universal Studios Florida
9,998,00 up 4.3% #6 North America, #9 worldwide
Islands of Adventure
9,362,000 up 6.5% #7 North America, #10 worldwide
Wet ‘n’ Wild Orlando
1,310,000 no change #4 North America waterparks, #11 worldwide waterparks
Universal Studios Singapore
4,100,000 down 2.4% #11 Asia, not ranked on worldwide list
Universal Studios Japan
14,500,000 up 4.3% #2 Asia, #4 worldwide

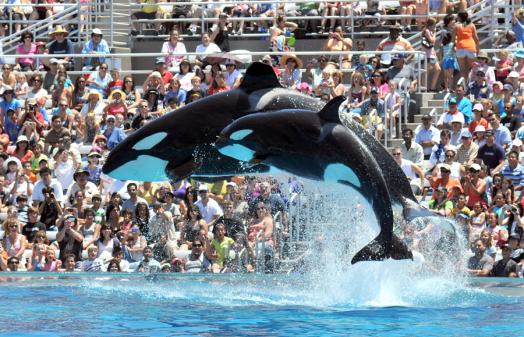
SeaWorld is still undergoing rebranding efforts. Attendance remained consistent with 2015 numbers at San Diego, with an increase towards the end of the year for the final One Ocean shows. In Orlando, attendance was down due to increased competition from Disney, Universal, and LEGOLAND, along with inclement weather and a drop in tourism from Latin America, especially Brazil, on which the park had become reliant. Both SeaWorld and Busch Gardens Tampa Bay saw decreases in attendance, which indicates that new attractions such as Mako and Cobra’s Curse are not enough to draw guests in a highly competitive market.
SeaWorld San Diego
3,528,000 no change #15 North America, not ranked on worldwide list; Aquatica San Diego not ranked
SeaWorld Orlando
4,402,000 down 7.9% #10 North America, #25 worldwide (ranked #22 in 2015); Discovery Cove not ranked; Aquatica Orlando 1,536,000 down 4% #3 North American waterparks, #7 worldwide
SeaWorld San Antonio
Neither SeaWorld San Antonio nor Aquatica San Antonio is ranked
Sesame Place
Not ranked
Busch Gardens Williamsburg
Theme park is not ranked, but Water Country USA makes the North American waterpark list at #6 with 733.000 up 1%
Busch Gardens Tampa Bay
4,169,000 down 2% #11 North America, not ranked worldwide; Adventure Island makes the North American waterpark list at #7 with 650,000 down 2%.
The full TEA/AECOM Theme Index can be downloaded HERE


You must be logged in to post a comment.